
Imagine trying to find a research direction among hundreds of journals. One article leads to another. A single keyword opens up dozens of topics. Then there are authors, citations, and reference lists that continue branching out.
If everything had to be read one by one, when would it ever end?
 This is one reason the ability to understand the research landscape is so important. Through Science Mapping, large collections of publications can be processed into a map that helps researchers identify emerging topics, relationships between topics, collaboration networks, and the development of a particular research field.
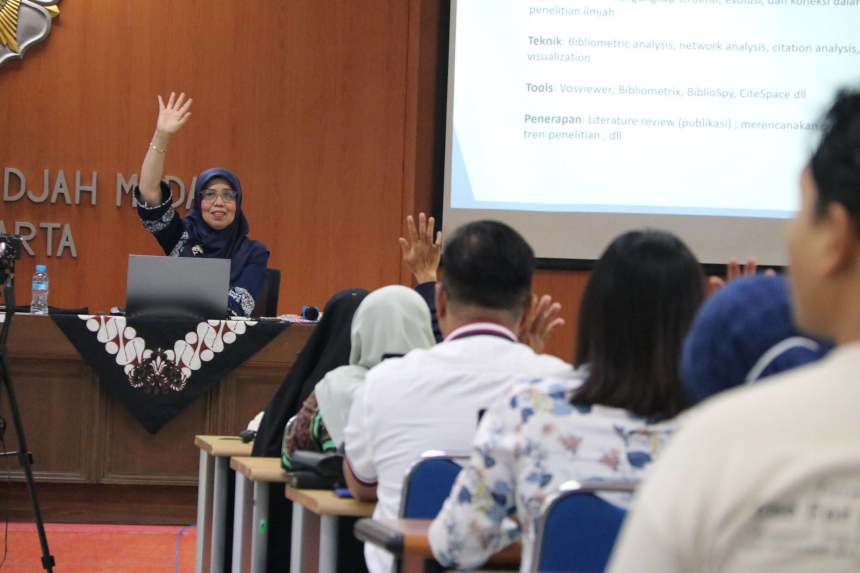
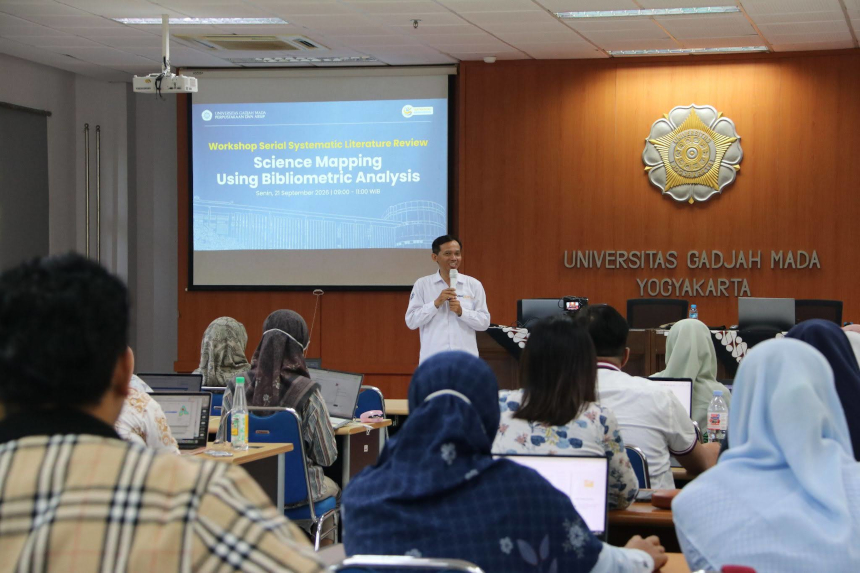
This approach to understanding the research landscape was introduced by the UGM Library and Archives through the Serial Literacy Workshop, Systematic Literature Review: Science Mapping Using Bibliometric Analysis, held on Monday (September 21). The hybrid workshop featured Dr. Purwani Istiana, M.A., Senior Librarian at UGM, as the speaker, with Ratna Setyawati, S.I.P., Librarian at UGM, serving as the moderator.
Opening the workshop, Arif Surachman, S.I.P., MBA, Head of the UGM Library and Archives, emphasized the importance of literacy activities like this in supporting the research process, particularly for the UGM academic community. He expressed hope that the knowledge gained from the workshop would help participants understand and make more effective use of scholarly literature.
“We hope this activity will be beneficial and help the UGM academic community in conducting research, particularly in understanding and making more effective use of various scholarly resources,” said Arif.
This expectation was then addressed through a session that introduced participants to methods for turning large collections of publications into easier-to-understand information. Purwani Istiana explained that Science Mapping is not simply about producing images or graphs, but about representing the structure and development of knowledge within a research field.
Through a science map, researchers can identify things that may be difficult to see when reading articles one by one, such as which topics appear most frequently, which themes are interconnected, who is collaborating with whom, and which areas of research are beginning to emerge.
“Science mapping helps us see the research landscape. From large amounts of publication data, we can identify which topics are developing, how topics are interconnected, and the collaboration networks that have been formed,” explained Purwani.
So, where does the map come from?
 This is where Bibliometric Analysis comes into play. The method is used to process scholarly publication data, including authors, keywords, citations, and references, to identify patterns and relationships. The results of the analysis can then be visualized as a science map.
Publication data can be retrieved from various scholarly databases, such as Scopus, Web of Science, and other sources, depending on the research needs. Once the publication data have been obtained, they need to be prepared and analyzed to identify relevant patterns. The results can then be visualized as a science map.
Simply put, Bibliometric Analysis helps identify patterns in publication data, while Science Mapping presents those patterns as a map that is easier to interpret.
During the workshop, participants were introduced to various techniques for examining the research landscape from different perspectives. Co-authorship analysis can be used to examine collaboration networks among researchers, while co-occurrence analysis maps keywords that frequently appear together, making research themes and clusters more visible.
Participants were also introduced to bibliographic coupling, which connects publications based on shared references; citation analysis, which examines publications based on citation counts; and co-citation analysis, which helps identify references that are frequently cited together.
Each technique addresses a different research question. To examine who collaborates with whom, researchers can use co-authorship analysis. To identify interconnected themes, co-occurrence analysis can be used. To explore the foundations or intellectual structure of a research field, bibliographic coupling and co-citation analysis can provide different perspectives.
 In this way, a science map goes beyond being an appealing visualization. It can help researchers understand the state of the art, identify emerging topics, determine the position of a particular study, and discover opportunities for further research and collaboration.
“The resulting map is not merely a visualization. We can use it to understand the state of the art, identify emerging topics, determine the position of a study, and discover opportunities for research and collaboration,” Purwani added.
To support the mapping process, participants were also introduced to two tools used in the science mapping workflow: OpenRefine and VOSviewer. Before visualization, publication data need to be cleaned and standardized. OpenRefine can be used at this stage to help organize the dataset and improve its consistency.
Once the data are ready, VOSviewer can be used to create network visualizations and science maps. Data that initially appears as a collection of information can be transformed into networks showing relationships among keywords, researchers, publications, and references.
From this point, thousands of publications are no longer simply a long list of articles. The data begin to reveal patterns. Patterns reveal relationships. And these relationships help researchers see the bigger picture of the field they are studying.
The activity is part of the UGM Library and Archives’ efforts to strengthen research literacy and support the academic community in utilizing technology to process scholarly information. This effort aligns with Sustainable Development Goal (SDG) 4: Quality Education by strengthening research knowledge and skills, and SDG 9: Industry, Innovation and Infrastructure by using technology and data analysis methods to support innovation in research.
Contributor: Wasilatul Baroroh